If you have ever worked with research data, surveys, business reports, or scientific studies, you have probably heard about SPSS. Many students, researchers, healthcare professionals, marketers, and business analysts rely on this powerful software to organize and analyze data. Yet many beginners still ask the same question: what is the SPSS software?
The answer is simple. SPSS is a professional statistical analysis program that helps users transform raw data into meaningful information. Instead of spending hours performing calculations manually, users can import data, clean it, analyze it, create charts, and generate reports with just a few clicks.
Over the years, SPSS has become one of the world’s most trusted statistical software solutions. Universities teach it in research courses, hospitals use it for medical studies, businesses analyze customer behavior with it, and government agencies depend on it for public policy research.
In this comprehensive guide, you will learn exactly what is the SPSS software, how it works, why professionals use it, and whether it is the right tool for your needs. This article goes beyond simply explaining the software by providing practical insights, real-world applications, and expert recommendations that help you understand both its strengths and limitations.
What Is the SPSS Software?
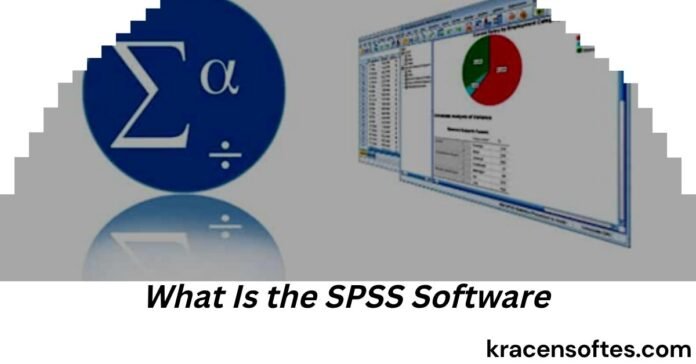
The exact answer to what is the SPSS software is that SPSS stands for Statistical Package for the Social Sciences. It is a software application designed to collect, organize, analyze, and visualize data.
Although SPSS was originally created for social science research, it has expanded far beyond that field. Today it is widely used in healthcare, finance, education, government, psychology, engineering, retail, marketing, manufacturing, sports science, and many other industries.
IBM currently owns and develops SPSS. Since IBM acquired the software, it has continued adding advanced statistical methods, artificial intelligence capabilities, automation features, and improved data management tools.
One of the biggest reasons for SPSS’s popularity is its user-friendly interface. Unlike programming languages that require coding knowledge, SPSS allows users to perform sophisticated statistical analyses using menus, buttons, and dialog boxes.
This makes it an excellent choice for beginners while still offering enough advanced features for experienced statisticians.
The Meaning Behind SPSS
Many people recognize the acronym without knowing its history.
SPSS originally meant:
- Statistical
- Package
- for the
- Social
- Sciences
The software was first developed to simplify statistical analysis for researchers working in sociology, psychology, education, economics, and political science.
As technology evolved, SPSS expanded into a complete data analytics platform suitable for nearly every industry that relies on data-driven decision making.
Today, while the abbreviation remains the same, SPSS is no longer limited to social sciences.
A Brief History of SPSS
Understanding the history of SPSS helps explain why it remains one of the most respected statistical software programs available.
The software was first introduced in 1968 by Norman H. Nie, C. Hadlai Hull, and Dale H. Bent.
Their goal was simple:
Researchers needed an easier way to analyze large datasets without manually calculating statistical formulas.
Before SPSS, statistical analysis often required expensive computers and complex programming.
SPSS changed everything by introducing an easier interface for statistical calculations.
Major milestones include:
- 1968: SPSS was first released.
- 1975–1990: Universities around the world adopted SPSS.
- 1990s: Business organizations began using SPSS for market research.
- 2009: IBM acquired SPSS Inc.
- 2010 onward: IBM integrated predictive analytics and AI-powered features.
- Today: SPSS supports advanced analytics, machine learning integration, automated modeling, and cloud-based workflows.
Its long history demonstrates reliability and continuous improvement, making it one of the most trusted names in statistical software.
Why Is SPSS So Popular?
Many statistical software packages exist today, yet SPSS remains one of the top choices worldwide.
Several reasons explain its lasting popularity.
Easy to Learn
One of SPSS’s greatest strengths is its graphical interface.
Most analyses can be completed without writing code.
This makes it ideal for students and first-time researchers.
Reliable Statistical Methods
SPSS includes hundreds of validated statistical procedures trusted by universities and research organizations.
Professional Reporting
The software automatically creates organized tables, charts, graphs, and summaries suitable for research papers and presentations.
Time Saving
Instead of performing lengthy calculations manually, SPSS automates the entire process.
Wide Industry Acceptance
Many employers specifically request SPSS experience because it is considered an industry standard.
Who Uses SPSS Software?
One common misconception is that SPSS is only for researchers.
In reality, professionals from many industries use it daily.
Common users include:
- University students
- College professors
- Medical researchers
- Psychologists
- Data analysts
- Business analysts
- Government agencies
- Marketing professionals
- Financial analysts
- Human resource specialists
- Healthcare organizations
- Pharmaceutical companies
- Nonprofit organizations
- Public health departments
The flexibility of SPSS allows organizations of all sizes to analyze information accurately.
What Problems Does SPSS Solve?
Modern organizations collect enormous amounts of information.
Without proper analysis, this data has little value.
SPSS helps answer important questions such as:
- Why are sales increasing?
- Which customers are most loyal?
- Which treatment works best?
- What factors affect employee satisfaction?
- What predicts student success?
- Which marketing campaign performs better?
- How can hospitals improve patient outcomes?
Instead of guessing, organizations use SPSS to make evidence-based decisions.
Main Features of SPSS Software
SPSS includes many powerful tools that work together to simplify data analysis.
Data Entry
Users can enter information manually or import data from external sources.
Supported formats include:
- Excel
- CSV
- SQL databases
- Google Sheets exports
- Text files
- SAS
- Stata
- Other statistical software
Data Cleaning
Raw datasets often contain errors.
SPSS helps identify:
- Missing values
- Duplicate records
- Incorrect entries
- Outliers
- Invalid responses
Cleaning data improves research accuracy.
Data Transformation
Users can modify existing variables by:
- Creating new variables
- Recoding values
- Combining categories
- Standardizing scores
- Calculating percentages
These transformations prepare data for deeper analysis.
Descriptive Statistics
Descriptive statistics summarize data.
Examples include:
- Mean
- Median
- Mode
- Standard deviation
- Variance
- Range
- Frequency tables
- Percentages
These statistics provide a quick overview before advanced analysis begins.
Advanced Statistical Analysis
SPSS supports hundreds of statistical methods.
Popular techniques include:
- T-tests
- ANOVA
- MANOVA
- Linear regression
- Logistic regression
- Correlation analysis
- Chi-square tests
- Factor analysis
- Cluster analysis
- Survival analysis
- Time series forecasting
- Mixed models
Users simply select options from menus rather than memorizing formulas.
Charts and Graphs
Visualizing information is essential.
SPSS can create:
- Bar charts
- Pie charts
- Histograms
- Scatter plots
- Line graphs
- Box plots
- Error bar charts
- Heat maps
- Distribution charts
These visuals make results easier to understand.
Output Viewer
Every analysis automatically generates organized reports.
The Output Viewer stores:
- Tables
- Statistical summaries
- Charts
- Graphs
- Significance values
- Confidence intervals
Reports can be exported into Word, Excel, PDF, or PowerPoint.
How Does SPSS Work?
Understanding the workflow makes SPSS much less intimidating.
The typical process follows several simple steps.
Step 1: Import Data
Users import data from surveys, spreadsheets, databases, or manual entry.
Step 2: Prepare the Dataset
Variables are labeled, missing values are checked, and formatting issues are corrected.
Step 3: Choose the Analysis
Users select the appropriate statistical test depending on the research question.
Step 4: Run the Analysis
SPSS performs all calculations automatically.
Step 5: Interpret Results
The software produces tables and charts that help users understand the findings.
Step 6: Export Results
Reports are exported for presentations, publications, or business reports.
This straightforward workflow is one reason beginners quickly become comfortable using SPSS.
Understanding the SPSS Interface
The SPSS interface is organized into several easy-to-use sections.
Data View
This resembles a spreadsheet.
Rows represent observations.
Columns represent variables.
Variable View
This section defines each variable.
Users can specify:
- Variable name
- Data type
- Width
- Decimal places
- Labels
- Missing values
- Measurement level
Proper variable setup improves analysis accuracy.
Output Window
After running statistical procedures, all results appear here.
This keeps analyses organized and easy to review.
Syntax Editor
Although SPSS works without programming, advanced users often write syntax commands.
Syntax allows:
- Automation
- Reproducibility
- Batch processing
- Documentation
Learning basic syntax can significantly improve productivity over time.
Also Read: What Is Software Architecture? A Complete Beginner’s Guide to Modern Software Architecture
Types of Data You Can Analyze in SPSS
SPSS supports nearly every common type of research data.
Examples include:
Survey Data
Customer satisfaction surveys
Employee engagement surveys
Political opinion polls
Healthcare questionnaires
Medical Data
Clinical trials
Patient records
Hospital performance
Disease research
Treatment comparisons
Business Data
Sales performance
Customer demographics
Marketing campaigns
Revenue analysis
Inventory trends
Educational Data
Student grades
Attendance records
Learning outcomes
Course evaluations
Academic research
Financial Data
Investment performance
Risk analysis
Consumer spending
Banking statistics
Insurance claims
This flexibility makes SPSS valuable across multiple industries.
Common Statistical Techniques Available in SPSS
One of SPSS’s biggest strengths is its extensive collection of statistical tools.
Correlation Analysis
Measures the relationship between variables.
Example:
Does study time increase exam scores?
Regression Analysis
Predicts future outcomes based on existing variables.
Businesses often forecast future sales using regression.
ANOVA
Compares averages across multiple groups.
Example:
Comparing customer satisfaction among three different stores.
Chi-Square Test
Determines whether two categorical variables are related.
Example:
Is gender associated with product preference?
Factor Analysis
Reduces many variables into smaller groups.
Researchers often use this in psychology and marketing.
Cluster Analysis
Groups similar observations together.
Businesses use clustering for customer segmentation.
Time Series Analysis
Examines trends over time.
Useful for forecasting demand, revenue, or population growth.
Real-World Examples of SPSS in Action
SPSS becomes much easier to understand when viewed through practical examples.
Healthcare Research
A hospital wants to determine whether a new treatment improves recovery time compared with the current treatment. Researchers collect patient data, analyze recovery rates in SPSS, and determine whether the differences are statistically significant. This helps doctors make evidence-based treatment decisions.
Marketing Analysis
A retail company surveys thousands of customers after launching a new advertising campaign. Using SPSS, analysts identify which age groups responded most positively, which products attracted the most attention, and which marketing channels produced the highest return on investment.
Education
A university studies the relationship between attendance, study habits, and final exam scores. SPSS helps researchers identify the strongest predictors of academic success, allowing educators to design more effective learning strategies.
Human Resources
A large organization wants to understand why employee turnover has increased. HR professionals analyze satisfaction surveys, salary data, work experience, and promotion history using SPSS to identify the factors that most influence employee retention.
These examples show that SPSS is not simply a statistics program—it is a decision-making tool that helps organizations solve real problems using data.
What Is the Latest Version of SPSS Software?
Many people researching what is the SPSS software also want to know what is the latest version of SPSS software.
As of 2026, IBM continues to update SPSS Statistics with new releases that improve usability, security, performance, and advanced analytics. The latest versions include enhancements to data visualization, statistical procedures, Python and R integration, cloud compatibility, and automation tools.
Instead of focusing only on adding new statistical tests, IBM now emphasizes making SPSS faster, smarter, and easier to use for both beginners and experienced analysts.
Some of the improvements in recent releases include:
- Faster data processing for large datasets
- Improved user interface
- Better chart customization
- Enhanced regression and predictive modeling tools
- Expanded Python integration
- More automation features
- Better compatibility with Microsoft Excel and modern file formats
- Improved reporting capabilities
If you are starting today, it is always recommended to use the newest available version because it includes the latest security updates, performance improvements, and statistical methods.
Advantages of Using SPSS Software
SPSS has remained one of the leading statistical software packages for decades because it offers many practical benefits.
Simple User Interface
Unlike programming-based statistical tools, SPSS uses menus, dialog boxes, and icons that make learning much easier.
Even beginners can perform professional analyses after only a short period of practice.
Saves Significant Time
Manual statistical calculations can take hours or even days.
SPSS automates these calculations in seconds while reducing the chance of human error.
Highly Accurate Results
The software uses validated statistical algorithms that have been trusted by universities, hospitals, government agencies, and businesses for many years.
Supports Large Datasets
Whether you have 500 survey responses or several million records, SPSS is designed to process large amounts of information efficiently.
Professional Reporting
SPSS produces publication-quality tables and charts that can be exported directly into research papers and business reports.
Excellent for Research
Thousands of academic journals publish research based on SPSS analysis.
Because of its widespread acceptance, many universities teach SPSS as part of their research methodology courses.
Limitations of SPSS Software
No software is perfect.
Understanding its limitations helps users decide whether SPSS is the right choice.
Commercial Licensing
SPSS is paid software.
Although student versions are available, full professional licenses can be expensive for individuals and small organizations.
Limited Customization Compared to Programming Languages
While SPSS offers many built-in features, programming languages such as R and Python provide greater flexibility for highly customized analyses.
Also Read: What Is SaaS Software? Complete Beginner’s Guide to Software as a Service
Complex Advanced Features
Basic analyses are easy.
However, advanced statistical modeling still requires a good understanding of research methods and statistics.
Less Suitable for Big Data Engineering
Although SPSS handles large datasets well, organizations working with massive cloud-based data warehouses often combine SPSS with other analytics platforms.
SPSS Software vs Excel
Many beginners wonder whether Excel can replace SPSS.
The answer depends on your goals.
Excel is excellent for organizing data, performing simple calculations, and creating basic charts.
SPSS goes much further by offering advanced statistical testing, predictive analytics, regression modeling, factor analysis, hypothesis testing, and research reporting.
For example:
Excel can calculate an average.
SPSS can determine whether the difference between two averages is statistically significant while automatically calculating confidence intervals, effect sizes, and probability values.
If your work involves research or statistical analysis, SPSS is the better option.
SPSS Software vs R
R is another popular statistical analysis tool.
Both programs are powerful, but they serve different audiences.
SPSS is ideal for users who prefer a graphical interface and minimal programming.
R is better suited for statisticians and data scientists who enjoy coding and need unlimited customization.
SPSS offers:
- Easier learning curve
- Menu-driven analysis
- Faster report creation
- Better for beginners
R offers:
- Free and open source
- Extremely flexible
- Advanced graphics
- Thousands of additional packages
Many experienced analysts actually use both tools together.
SPSS Software vs Python
Python has become one of the most popular programming languages for data science.
However, Python requires coding knowledge.
SPSS focuses on making statistical analysis accessible without extensive programming.
Python is often preferred for:
- Artificial intelligence
- Machine learning
- Automation
- Web applications
- Big data
SPSS is preferred for:
- Academic research
- Clinical studies
- Survey analysis
- Social science research
- Business reporting
Interestingly, modern SPSS versions also support Python integration, allowing users to combine the strengths of both platforms.
Industries That Depend on SPSS
The versatility of SPSS explains why so many industries continue using it.
Healthcare
Hospitals analyze patient outcomes, treatment effectiveness, infection rates, and clinical research data.
Pharmaceutical Companies
Drug manufacturers rely on SPSS during clinical trials to evaluate the safety and effectiveness of medications.
Education
Universities use SPSS to teach statistics while researchers analyze student performance, educational policies, and learning outcomes.
Marketing
Businesses analyze customer preferences, buying behavior, advertising effectiveness, and market segmentation.
Government
Government agencies study census information, employment statistics, crime data, economic trends, and public health reports.
Finance
Financial institutions evaluate investment risks, customer behavior, loan performance, and fraud detection.
Manufacturing
Manufacturers improve quality control, monitor production processes, and reduce defects through statistical analysis.
How SPSS Supports Better Decision-Making
One of the biggest strengths of SPSS is that it transforms data into practical insights.
Imagine a business notices declining sales.
Without analysis, managers may simply guess the reason.
With SPSS, they can examine customer demographics, pricing, marketing campaigns, seasonal trends, and purchasing behavior to identify the real cause.
Similarly, healthcare organizations can determine which treatments improve recovery rates, while schools can identify factors that help students succeed.
This evidence-based approach reduces guesswork and leads to smarter decisions.
Tips for Beginners Learning SPSS
Learning SPSS is much easier when you follow a structured approach.
Start with the basics before exploring advanced statistical methods.
Helpful tips include:
- Learn how variables work.
- Practice importing Excel datasets.
- Understand measurement levels such as nominal, ordinal, and scale.
- Master descriptive statistics first.
- Learn how to interpret output tables.
- Practice creating charts.
- Study one statistical test at a time.
- Save syntax files for repeated analyses.
- Verify data quality before running statistical tests.
- Focus on interpreting results rather than simply generating them.
Consistent practice is the fastest way to build confidence.
Common Mistakes Beginners Make
Many new users make similar errors.
Avoid these common mistakes:
- Importing poorly organized data.
- Choosing the wrong statistical test.
- Ignoring missing values.
- Misinterpreting p-values.
- Forgetting to check assumptions before analysis.
- Using too many variables without a clear research question.
- Relying only on software without understanding the underlying statistics.
SPSS is powerful, but meaningful results depend on proper research design and correct interpretation.
Is SPSS Worth Learning in 2026?
Absolutely.
Despite the rapid growth of artificial intelligence and data science tools, SPSS continues to play an important role in research and business analytics.
It remains especially valuable for:
- College students
- Graduate researchers
- Medical professionals
- Market researchers
- Social scientists
- Government analysts
- Business intelligence teams
- Public health researchers
Many employers still list SPSS as a preferred or required skill because it combines reliability, ease of use, and professional reporting.
Learning SPSS can also provide a strong foundation before moving on to more advanced analytics platforms.
The Future of SPSS Software
The future of SPSS is likely to focus on intelligent analytics.
Emerging trends include:
- Greater AI-assisted analysis
- Increased automation
- Better cloud integration
- Improved predictive analytics
- Stronger machine learning support
- Enhanced collaboration tools
- More interactive dashboards
- Faster processing of larger datasets
Rather than replacing human analysts, these improvements help professionals work more efficiently and make more informed decisions.
Expert Insights: Is SPSS Still Relevant?
Some people assume that newer technologies have made SPSS obsolete.
In reality, SPSS remains highly relevant because of its balance between simplicity and statistical power.
For organizations that need dependable statistical analysis without extensive programming, SPSS continues to be one of the best choices available.
Its long-standing reputation, continuous updates, and widespread adoption across industries make it a valuable tool for anyone working with data.
The key to success is not simply knowing how to click buttons in the software but understanding the research questions, selecting appropriate statistical methods, and interpreting the results correctly. When used this way, SPSS becomes much more than software—it becomes a reliable decision-support system.
Conclusion
If you have been asking what is the SPSS software, the answer is now much clearer.
SPSS is a powerful statistical analysis platform that helps users organize, analyze, interpret, and visualize data. From universities and hospitals to businesses and government agencies, professionals rely on SPSS to transform raw information into meaningful insights.
Its easy-to-use interface, extensive collection of statistical tools, professional reporting capabilities, and continued development by IBM have helped it remain one of the world’s most respected statistical software packages.
Whether you are a student writing your first research paper, a healthcare professional analyzing patient outcomes, or a business analyst exploring customer behavior, SPSS provides the tools needed to make accurate, evidence-based decisions.
As data continues to drive innovation across every industry, learning SPSS remains a valuable investment that can strengthen your research skills, improve your career opportunities, and help you make smarter decisions based on facts rather than assumptions.
Frequently Asked Questions (FAQs)
Can I use SPSS without a statistics background?
Yes. Beginners can learn basic SPSS functions without advanced statistical knowledge. However, understanding statistical concepts will help you interpret results more accurately over time.
Does SPSS require programming skills?
No. Most tasks can be completed through its graphical interface. Advanced users can also use syntax, Python, or R for automation and customization.
Can SPSS analyze survey data from Google Forms?
Yes. After exporting responses to Excel or CSV format, you can import the data into SPSS for analysis.
Is SPSS suitable for qualitative research?
SPSS is primarily designed for quantitative data. Researchers often pair it with qualitative analysis software when working with interviews or open-ended responses.
Can SPSS create publication-ready charts?
Yes. SPSS includes many chart types that can be customized and exported for academic journals, reports, and presentations.
Does SPSS work on both Windows and macOS?
Yes. IBM provides versions of SPSS for both Windows and macOS, allowing users to work across different operating systems.
Can multiple users collaborate on SPSS projects?
Yes. Teams can share datasets, syntax files, and output files, making collaboration easier for research groups and organizations.
How long does it take to learn SPSS?
Most beginners can learn the basics in a few weeks with regular practice. Mastering advanced statistical methods may take several months, depending on your experience and learning goals.
Can SPSS handle missing data automatically?
SPSS provides several methods for identifying, managing, and analyzing missing data, allowing researchers to choose the most appropriate approach for their study.
Is SPSS a good career skill?
Yes. SPSS remains a highly valued skill in research, healthcare, education, marketing, finance, public policy, and many other industries. Adding SPSS to your resume can improve your job prospects, especially for roles involving data analysis and research.